|
|

Karim Elgendy
Following the UNFCCC’s 23rd Conference of Parties in Bonn (COP23), Carboun has released a visual guide to climate change in the Middle East and North Africa region. The visual guide comprises two infographics covering carbon emissions in the Middle East and North Africa and climate change impact. The aim of this infographic is to explain carbon emissions from the Middle East and North Africa and the Arab World regions in the global context, especially the relationship between total emissions, per capita emissions, and emissions per unit of GDP. This infographic is the second of two representing the visual guide to climate change in the Middle East and North Africa region. The first part can be viewed here. The guide, which was researched and designed by Karim Elgendy, was based on raw data provided by a variety of sources and datasets (all of which are listed on the infographics). It represents an update of a previous visual guide published in 2011, which also aimed to contextualize regional carbon trends. Copyrights for all infographics are reserved for Carboun. No republishing or reproduction of this infographic or part thereof is allowed in digital, print, or other formsts without prior written consent from Carboun.
Continue reading Climate Change in the Middle East and North Africa : Carbon Intensity

Karim Elgendy
Following the UNFCCC’s 23rd Conference of Parties in Bonn (COP23), Carboun has released a visual guide to climate change in the Middle East and North Africa region. The visual guide comprises two infographics covering carbon emissions in the Middle East and North Africa and climate change impact. The aim of this infographic is to explain carbon emissions from the Middle East and North Africa region in the global context, especially how they relate to economic development, climate change, and climate committments under the Paris Agreement. This infographic is the first of two representing the visual guide to climate change in the Middle East and North Africa region. The second partcan be viewed here.The guide, which was researched and designed by Karim Elgendy, was based on raw data provided by a variety of sources and datasets (all of which are listed on the infographics). It represents an update of a previous visual guide published in 2011, which also aimed to contextualize regional carbon trends. Copyrights for all infographics are reserved for Carboun. No republishing or reproduction of this infographic or part thereof is allowed in digital, print, or other formsts without prior written consent from Carboun.
Continue reading Climate Change in the Middle East and North Africa : Carbon Emissions
Karim Elgendy
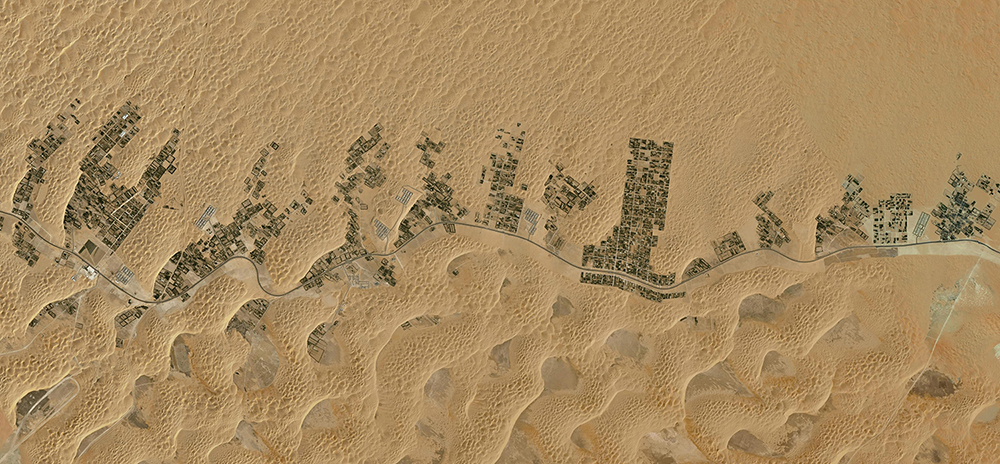 Liwa date farms benefit from some of the freshest ground water in the UAE. Copyrights: Google Those who visit the Middle East and North Africa from more temperate climates are often struck with how hot and dry the region is, and how scarce its rainfall. Some wonder why cities became established here, and how they continue to exist despite the lack of renewable freshwater.
These concerns are not entirely groundless. Yet these cities’ existence is not in any way miraculous: it’s merely an example of what can happen if cities fail to strike a sustainable balance between growth and limited resources.
Continue reading How Sustainable is Your Oasis?: A Review of Water Resources in Middle East Cities

Karim Elgendy
In celebrating this year’s World Green Building Week, Carboun has released a visual guide to energy use in buildings with the goal of explaining the overall state of energy use in the region and the significance of buildings as a major sector in energy consumption. It also aims to comparatively explain the nuances of the major trends of energy use in buildings as a baseline analysis for further research. The visual guide, which was researched and designed by Karim Elgendy with additional contributions from a small research team, was based on raw data obtained from the International Energy Agency and the World Bank. Copyrights for all infographics are reserved for Carboun. No reproduction or republishing of any infographic or part thereof is permitted without prior written consent from the author.
Continue reading A Visual Guide to Energy Use in Buildings in the Middle East

Karim Elgendy
Following on Carboun’s recent article discussing the two trends of energy and carbon emissions in the Arab World. Carboun has recently released a visual guide to energy and emissions with the goal of explaining the fundamentals of energy use in the region and how it relates to carbon emissions, economic development, climate change, and renewable energy. The guide, which was researched and designed by Karim Elgendy, was based on raw data provided by the World Bank and the World Resources Institute. It aims to explain the regional trends in local details but within the global context. Copyrights for all infographics are reserved for Carboun. No reproduction or republishing of any infographic or part thereof without prior written consent from Carboun.
Continue reading A Visual Guide to Energy and Emissions in the Middle East
Karim Elgendy
Discussions on the environment in the Arab World have traditionally been limited to the negative impact of region’s fossil fuel exports on climate change. In recents years, a more regional discourse has emerged that also addressed the region’s water scarcity, rapid urbanization, environmental degradation, and the expected impact of global climate change and sea level rise on its most vulnerable regions.
 Map showing emissions in countries of the arab world as percentage of global emissions. Copyrights: Carboun However, such discussions often overlooked the region’s own energy and ecological footprints and the impact of its own energy use on climate change. In the past , such disregard may have been justified by the fact that the region had not yet experienced the kind of economic development and prevalent consumerism that was common in most of the developed world. Such justification was supported by the region’s historically low rate of energy use and carbon emissions. In fact, the Arab world which constitutes 5% of the world’s population, emits just under 5% of global carbon emissions according to World Bank data, and except for Saudi Arabia, no single Arab country is responsible for more than 1% of global emissions. The energy use of an average Arab person is still below the world average and less than half that of an average european.
Continue reading Two Trends of Energy and Carbon Emissions in the Arab World
|
|