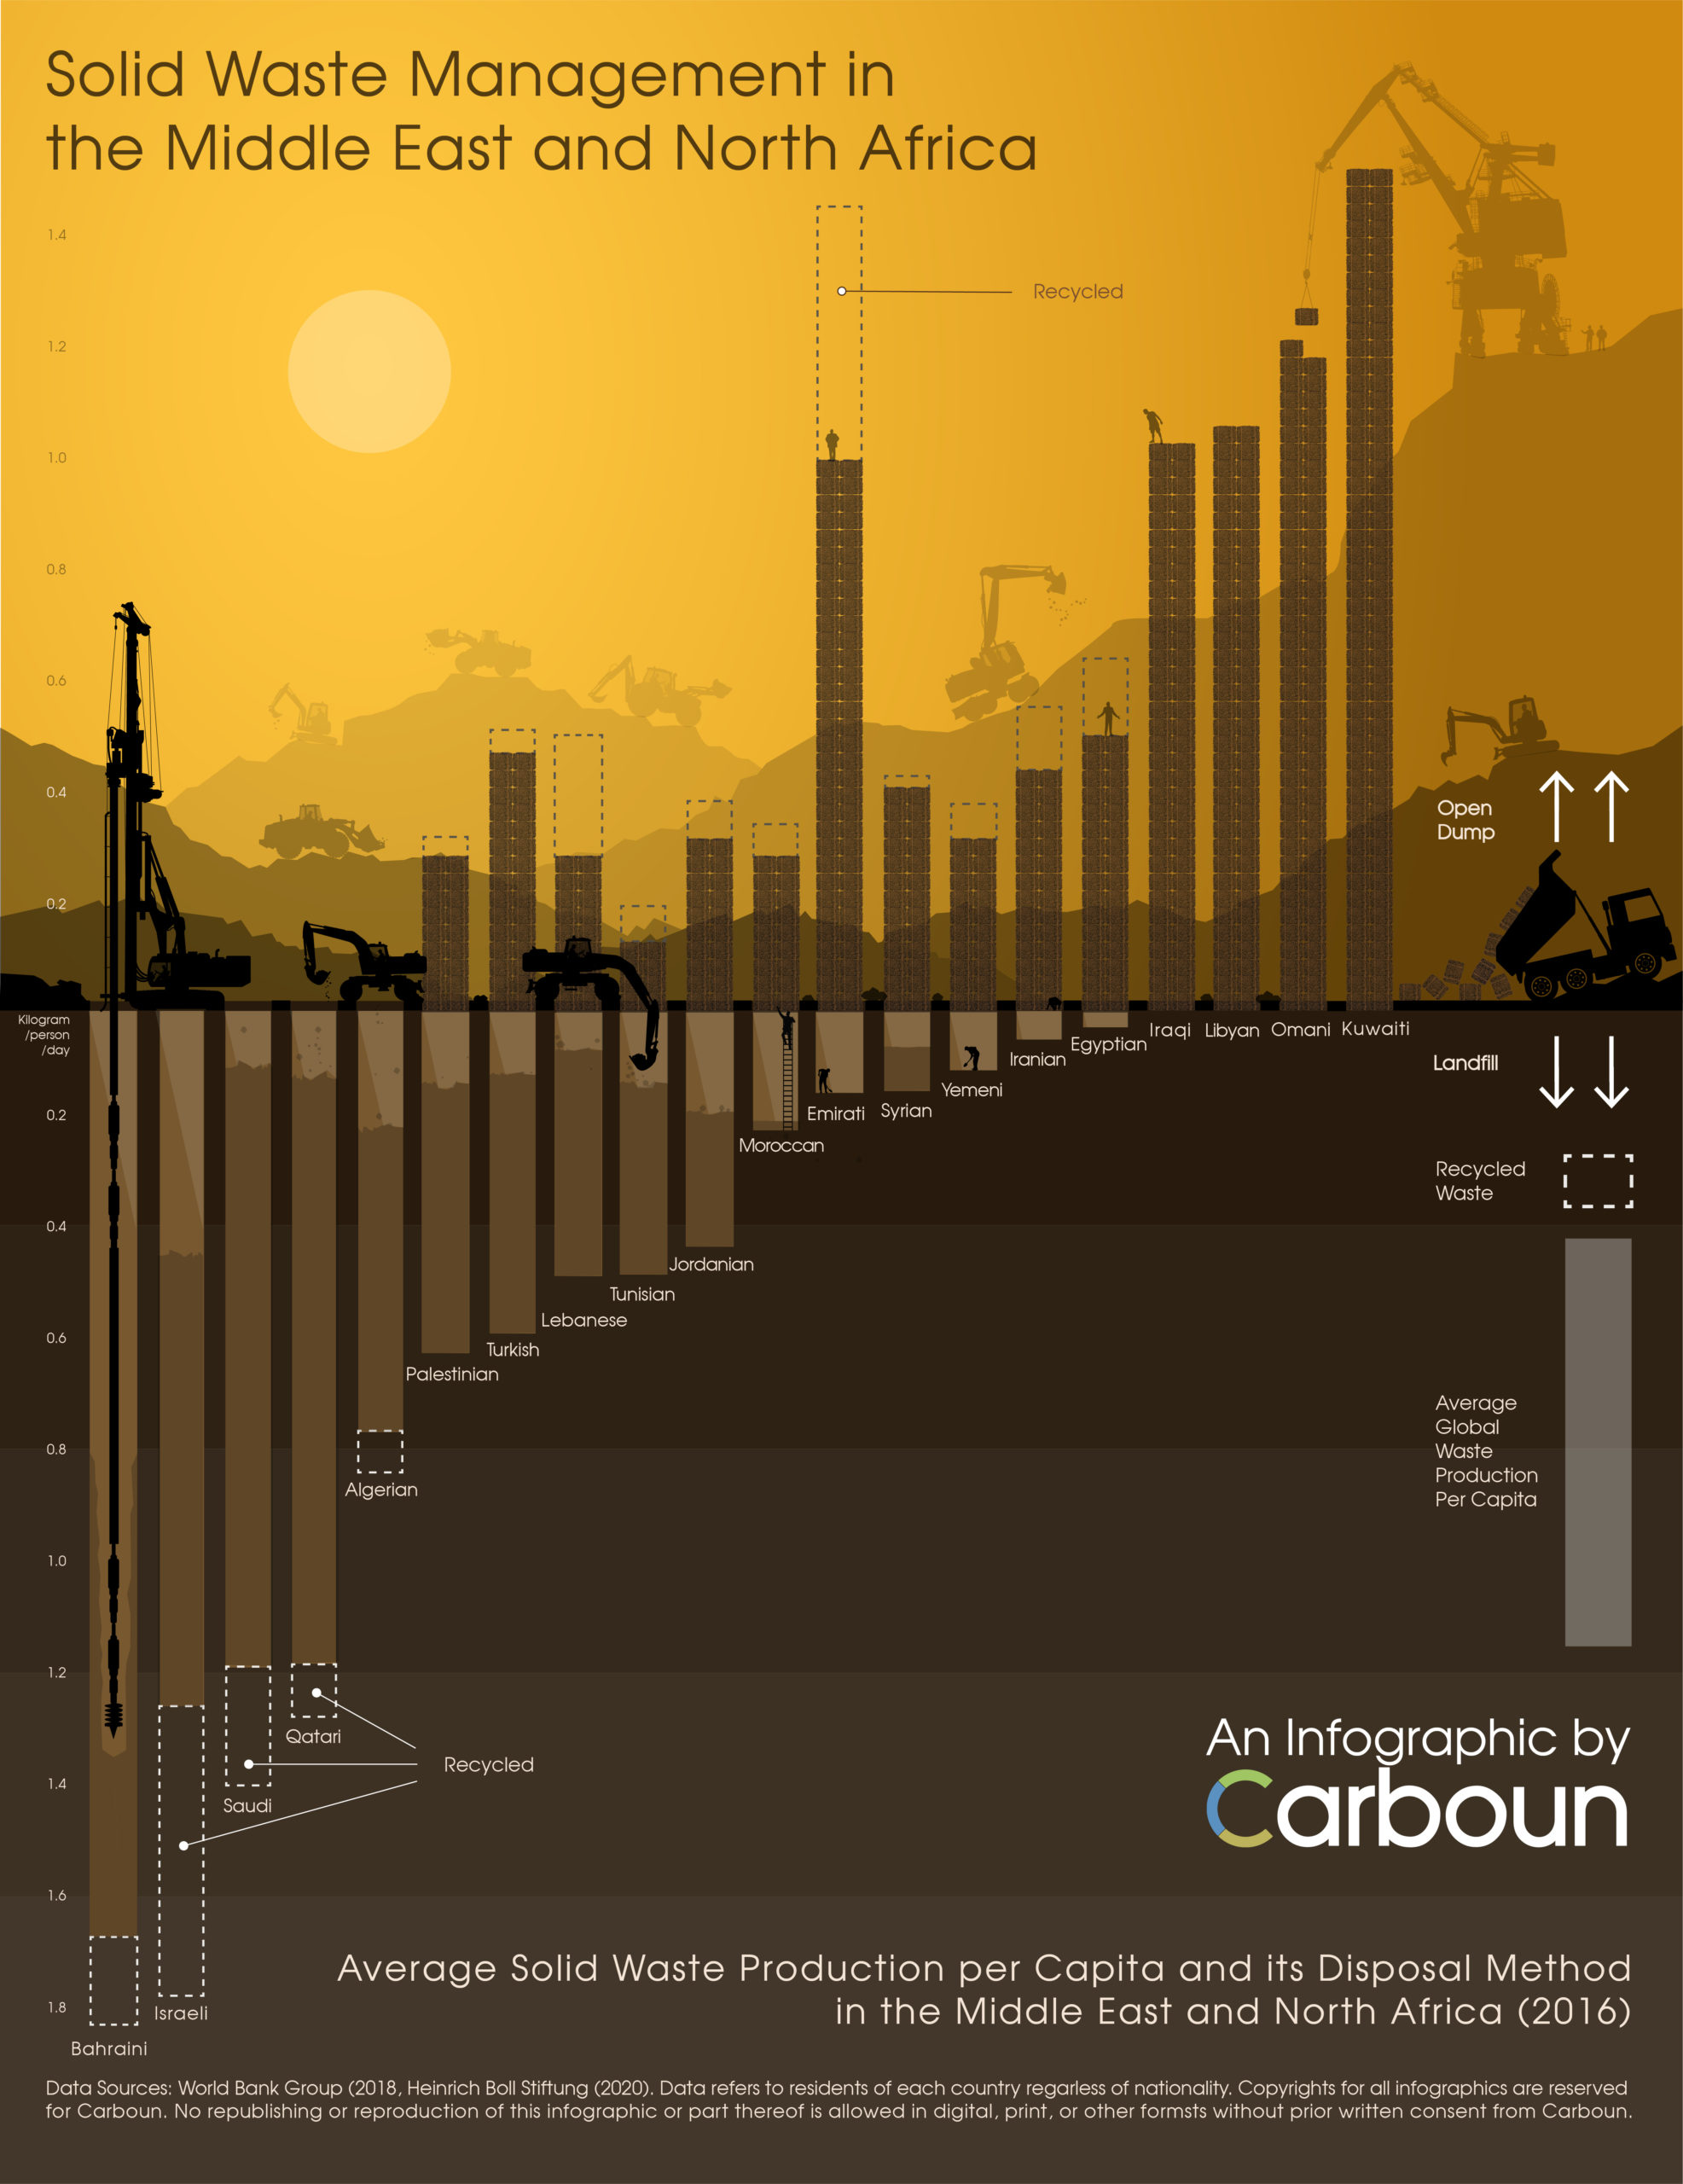
The Middle East and North Africa generates slightly more Municipal solid waste per capita than the global average. Yet per capita waste generation widely between regional countries that have high levels of material consumption and waste generation and others with much lower levels of consumption. This variation is most obvious between the GCC countries on the one hand, and the Levant and North African countries on the other.
With an average of 1.5 kilograms of municipal solid waste generation per person per day in the GCC, waste generation is more than double that of the average Levant and North Africa resident, which is estimated at 0.7 kilograms. One exception to this is Israel, which at 1.77 kilograms of solid waste per capita per day, is higher than the GCC average.
Since the start of the industrial age at the end of the 19th century, global surface temperatures have been on the rise due to increased carbon emissions. It is estimated that the earth’s surface temperature has already increased by an average of 0.9° C since then with obvious impacts on the global climate patterns.
The pattern of such warming has varied between different regions. Even within certain regions, sub-regional variations can be detected. In the Middle East and North Africa region, for example, there are sub-regional variations in how countries have warmed between 1880 and 2019, which correlate with their proximity to the Mediterranean Sea or the Persian/Arabian Gulf.
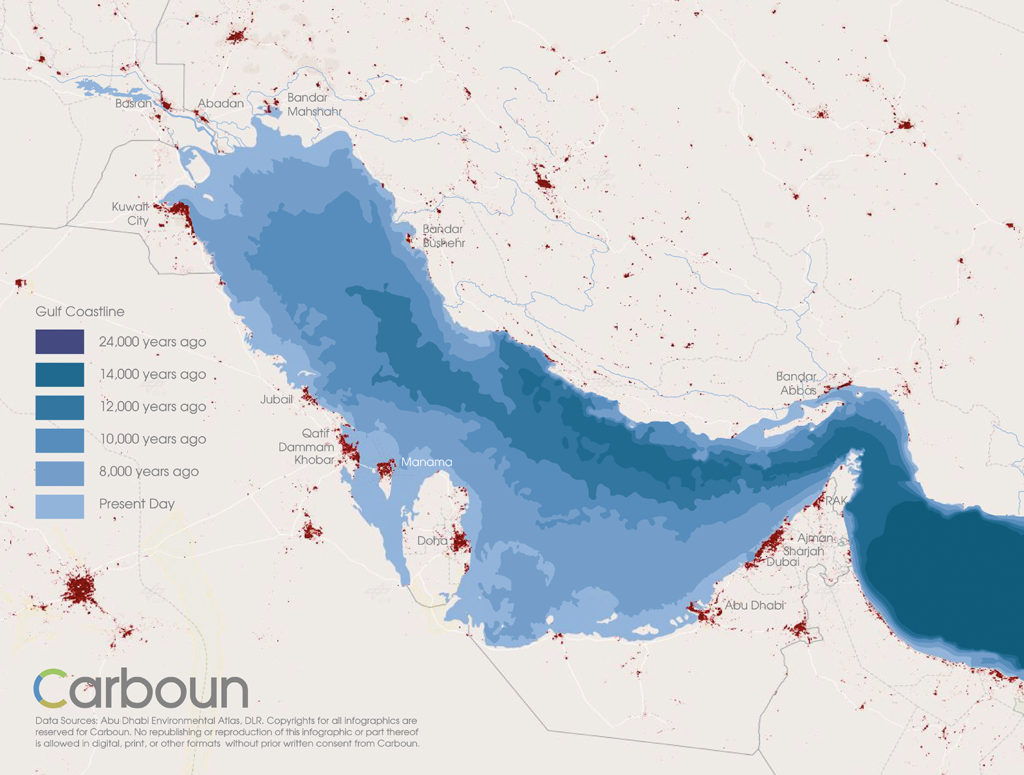
As the last ice age ended, the earth’s climate began to warm up, glaciers and ice sheets started to melt, and sea levels rose globally. With sea levels rising, seawater (once again) flooded into the Gulf (also known as the Persian Gulf or Arabia Gulf), whose sea floor was exposed for millennia and covered in sand dunes (except for lakes and the Tigris-Euphrates river meandering across it towards the Arabian sea).
Human settlements have traditionally needed an environmental rationale to exist where they do. They needed access to freshwater and to ecosystems that have enough biocapacity to produce biological materials to sustain their residents. Settlements also required a climate that was moderate enough – or can be economically moderated – to support human habitation.
But for these settlements to become thriving cities, the prerequisites above were not enough. Successful cities depended to a large extent on their integration into an efficient trade network.
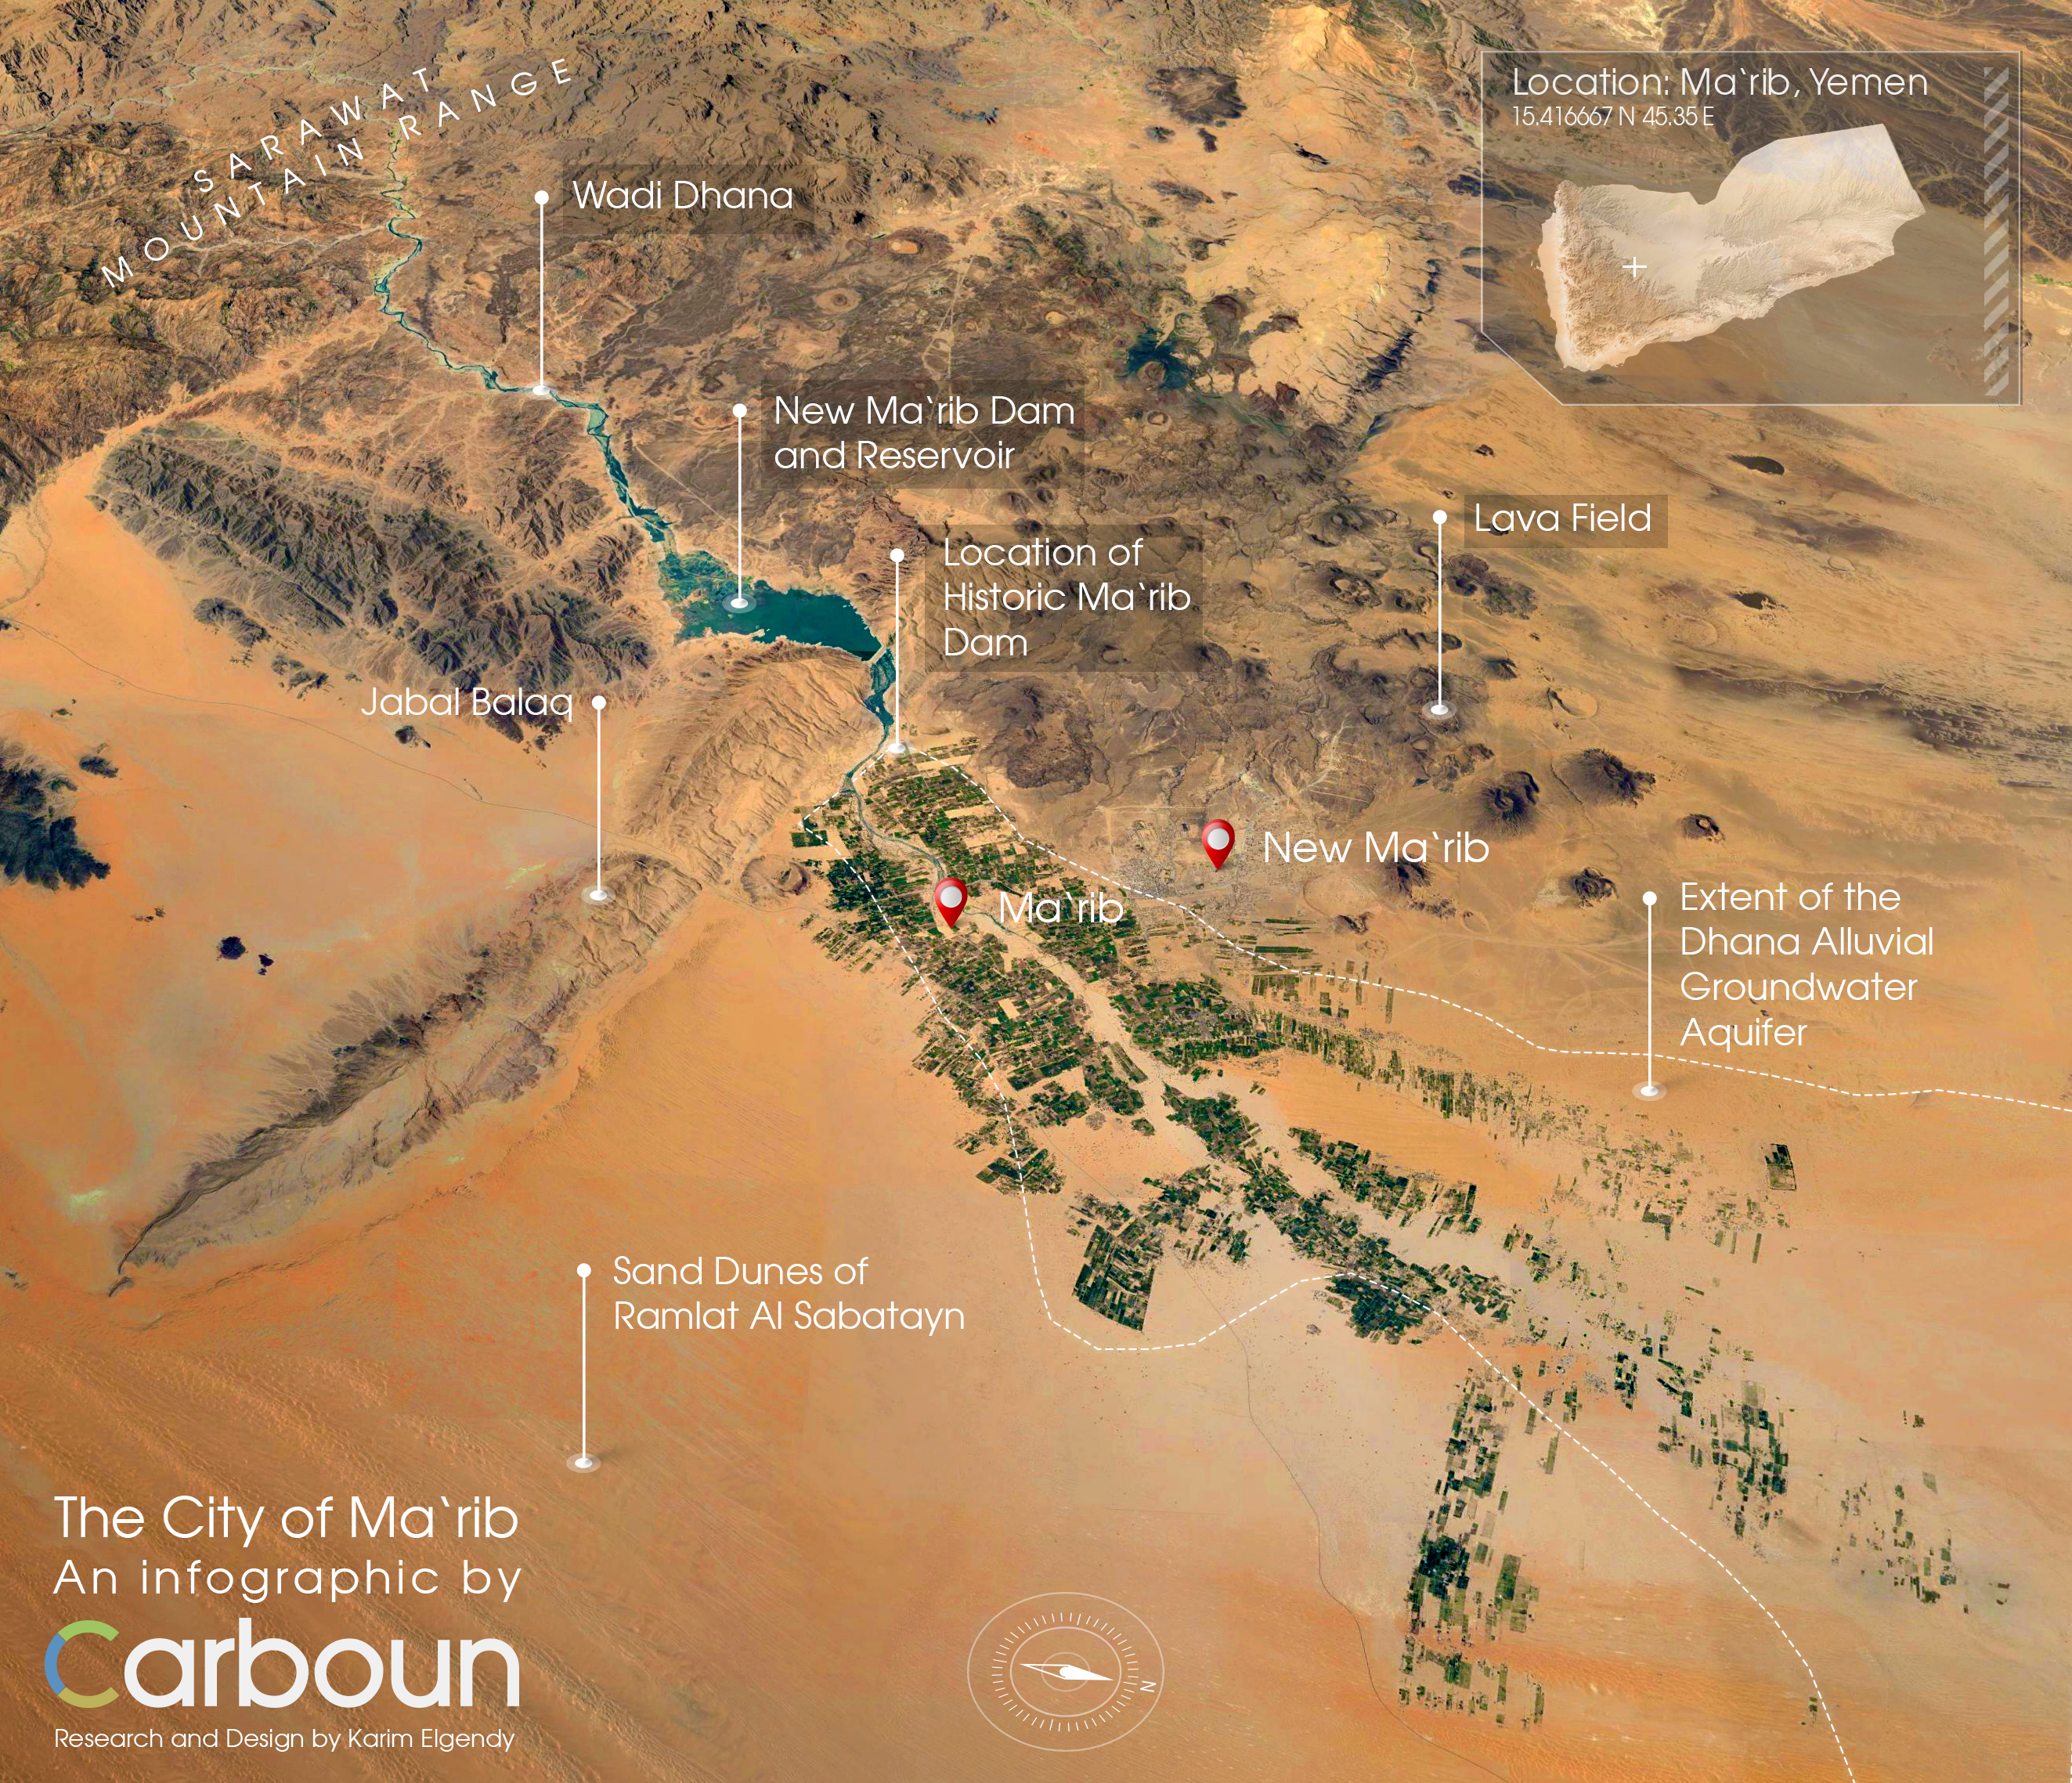
One historic regional example of this is the rise and fall of the city of Ma’rib, which is today a settlement of less than 20,000 people just 75 miles east of the Yemeni capital Sana’a, but for almost a millennium, was one of the region’s greatest cities.
Most cities have a good reason for being located where they are. The major Palestinian cities of the WestBank are excellent regional examples of rational city location. The old cities of Jerusalem, Hebron, Bethlehem, Ramallah, Jenin, and Nablus are all located on the flat ridges of the West Bank mountain range, benefiting from mild climate and significant rainfall – unlike locations only 15 miles to the east such as the oasis city of Jericho.
Following the UNFCCC’s 23rd Conference of Parties in Bonn (COP23), Carboun has released a visual guide to climate change in the Middle East and North Africa region. The visual guide comprises two infographics covering carbon emissions in the Middle East and North Africa and climate change impact. The aim of this infographic is to explain carbon emissions from the Middle East and North Africa and the Arab World regions in the global context, especially the relationship between total emissions, per capita emissions, and emissions per unit of GDP. This infographic is the second of two representing the visual guide to climate change in the Middle East and North Africa region. The first part can be viewed here. The guide, which was researched and designed by Karim Elgendy, was based on raw data provided by a variety of sources and datasets (all of which are listed on the infographics). It represents an update of a previous visual guide published in 2011, which also aimed to contextualize regional carbon trends. Copyrights for all infographics are reserved for Carboun. No republishing or reproduction of this infographic or part thereof is allowed in digital, print, or other formsts without prior written consent from Carboun.
In Pursuit of Sustainable Energy Sources : Challenges and Solutions
Karim Elgendy, Founder and Coordinator of Carboun, was recently commissioned by Frederich Ebert Foundation (Frederich Ebert Stiftung) to produce a set of visual guides to renewable energy in the Arab World to coincide with the 23rd Conference of Parties (COP23). The infographic below is the third of three visual guides. It represents an analysis of the challenges facing renewable energy growth in the Arab World. The three guides, which were researched and designed by Karim Elgendy for the Frederich Ebert Foundation, were based on raw data provided by International Renewable Energy Agency (IRENA), Regional Center for Renewable energy and Energy Efficiency (RCREEE), Lazard, World Energy Council, and Bloomberg. Copyrights for this infographic are reserved for the Frederich Ebert Foundation and the author. No reproduction or republishing of any infographic or part thereof without prior written consent from Frederich Ebert Foundation and the author. Guide 1 covers the state of the region and Guide 2 covers Regional Aspirations. They can also be reached via the infographics page.