Climate Change in the Middle East and North Africa : Carbon Intensity

emissions-infographics-banner21 copy

Karim Elgendy

Following the  UNFCCC’s 23rd Conference of Parties in Bonn (COP23), Carboun has released a visual guide to climate change in the Middle East and North Africa region. The visual guide comprises two infographics covering carbon emissions in the Middle East and North Africa and climate change impact. The aim of this infographic is to explain carbon emissions from the Middle East and North Africa  and the Arab World regions in the global context, especially the relationship between total emissions, per capita emissions, and emissions per unit of GDP. This infographic is the second of two representing the visual guide to climate change in the Middle East and North Africa region. The first part can be viewed here. The guide, which was researched and designed by Karim Elgendy, was based on raw data provided by a variety of sources and datasets (all of which are listed on the infographics). It represents an update of a previous visual guide published in 2011, which also aimed to contextualize regional carbon trends. Copyrights for all infographics are reserved for Carboun. No republishing or reproduction of this infographic or part thereof is allowed in digital, print, or other formsts without prior written consent from Carboun.

Continue reading Climate Change in the Middle East and North Africa : Carbon Intensity

Policies to Buildings: The UAE’s Emergence as the GCC’s Sustainability Leader

UAE Map

Karim Elgendy

Settling along the shores of the gulf

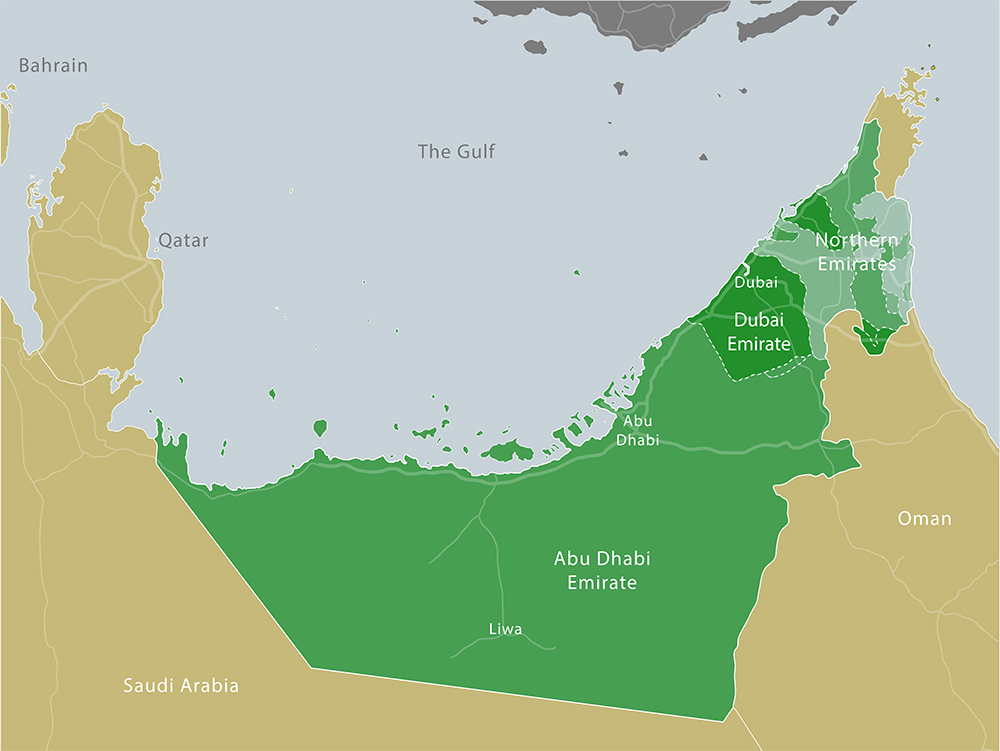
In the barren deserts of the Arabian Peninsula, people have always settled in locations that provided freshwater and enough natural resources to enable trade and economic development. Human settlements in the southern shores of the Gulf, in what we now know as the United Arab Emirates (UAE), are no exceptions to this.

For the last four centuries, the Bedouins of the Banu Yas tribes have settled a strip of land along the northern edge of the dune fields of the Arabian Peninsula’s Empty Quarter. Drawn to its plentiful ground water resources they established what is now known as the Liwa Oasis and developed date plantations which provided subsistence. But when fresh water was discovered on the Abu Dhabi Island in the late 18th century, Al Bu Falah branch of Banu Yas moved to the coastal location which – in addition to providing fresh water- also allowed them to develop pearling industry and trade.

In the early 19th century, another branch of the Banu Yas, known as Al Bu Falasa, moved from the Abu Dhabi Island to settle near a natural creek 90 miles east of the Abu Dhabi Island. In addition to ground water and pearling, the creek – now known as the Dubai  Creek- allowed the establishment of a port which facilitated trade with neighbors across the gulf and beyond. They quickly established a settlement on the western shore the creek – known later as Bur Dubai – but had to abandon it two decades later and move to the eastern shore after a smallpox outbreak. By the end of the 19th century, the combined advantages of fresh water availability, the natural port, the pearling industry, and the good geographic location, were sufficient for the new settlement to endure a sweeping fire that burnt through most of it dwellings. The Bedouins that have settled in Dubai sought no other location and simply rebuilt their settlement.

Continue reading Policies to Buildings: The UAE’s Emergence as the GCC’s Sustainability Leader

Climate Change in the Middle East and North Africa : Carbon Emissions

emissions-infographics-banner21

Karim Elgendy

Following the  UNFCCC’s 23rd Conference of Parties in Bonn (COP23), Carboun has released a visual guide to climate change in the Middle East and North Africa region. The visual guide comprises two infographics covering carbon emissions in the Middle East and North Africa and climate change impact. The aim of this infographic is to explain carbon emissions from the Middle East and North Africa region in the global context, especially how they relate to economic development, climate change, and climate committments under the Paris Agreement. This infographic is the first of two representing the visual guide to climate change in the Middle East and North Africa region. The second partcan be viewed here.The guide, which was researched and designed by Karim Elgendy, was based on raw data provided by a variety of sources and datasets (all of which are listed on the infographics). It represents an update of a previous visual guide published in 2011, which also aimed to contextualize regional carbon trends. Copyrights for all infographics are reserved for Carboun. No republishing or reproduction of this infographic or part thereof is allowed in digital, print, or other formsts without prior written consent from Carboun.

Continue reading Climate Change in the Middle East and North Africa : Carbon Emissions