Karim Elgendy
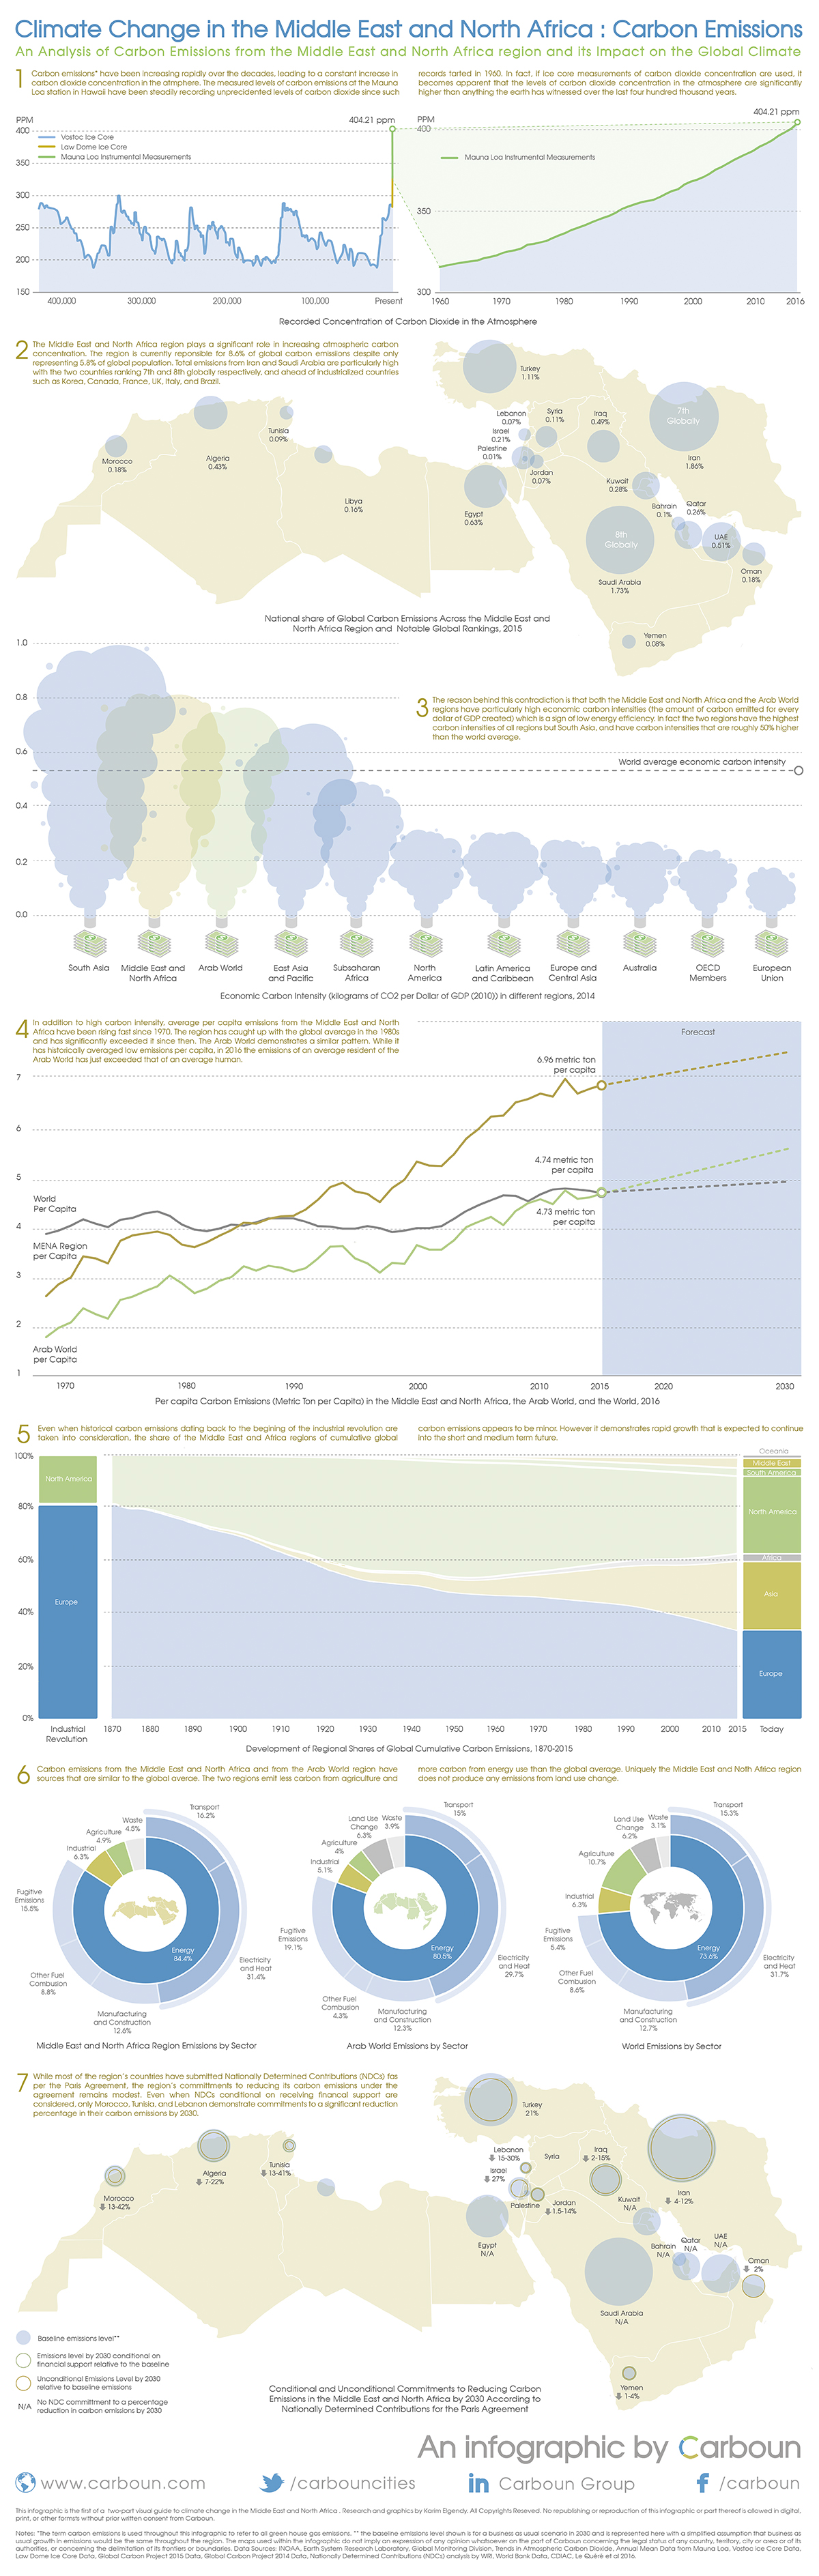
Following the UNFCCC’s 23rd Conference of Parties in Bonn (COP23), Carboun has released a visual guide to climate change in the Middle East and North Africa region. The visual guide comprises two infographics covering carbon emissions in the Middle East and North Africa and climate change impact. The aim of this infographic is to explain carbon emissions from the Middle East and North Africa region in the global context, especially how they relate to economic development, climate change, and climate committments under the Paris Agreement. This infographic is the first of two representing the visual guide to climate change in the Middle East and North Africa region. The second partcan be viewed here.The guide, which was researched and designed by Karim Elgendy, was based on raw data provided by a variety of sources and datasets (all of which are listed on the infographics). It represents an update of a previous visual guide published in 2011, which also aimed to contextualize regional carbon trends. Copyrights for all infographics are reserved for Carboun. No republishing or reproduction of this infographic or part thereof is allowed in digital, print, or other formsts without prior written consent from Carboun.
![]()
The maps used within the infographic do not imply an expression of any opinion whatsoever on the part of the Carboun initiative concerning the legal status of any country, territory, city or area or of its authorities, or concerning the delimitation of its frontiers or boundaries
To discuss this infographic, please join Carboun’s discussion group on Linkedin. For news and updates on sustainability from around the region, join Carboun’s Facebook page or follow its Twitter feed.